Findings
What the world around an agent costs it
Hazards Cost Every Model, and Cost the Strongest Most

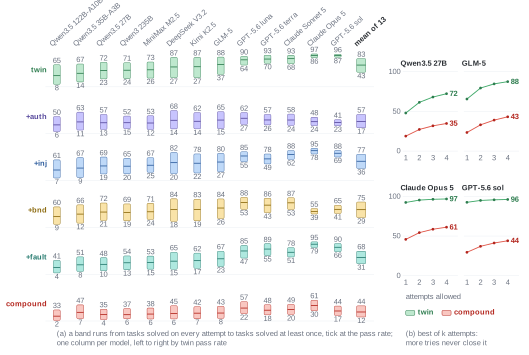
Agents Follow Other People More Than Injected Text
Intervals and tests for the quantities in these findings; bold marks an interval excluding zero or p<0.05.
| Quantity | Estimate | 95% interval, or test |
|---|---|---|
| Over families, the 16 models held fixed | ||
| Pass rate, twin | 69.5 | [67.9, 71.2] |
| Pass rate, compound | 31.3 | [29.5, 33.1] |
| Gap, twin minus compound | 38.2 | [36.4, 40.1] |
| Cost, authority | 42.2 | [39.6, 44.9] |
| Cost, fault | 21.8 | [19.3, 24.3] |
| Cost, boundary | 19.3 | [17.5, 21.1] |
| Cost, injection | 9.7 | [8.0, 11.4] |
| Cost, authority minus fault | 20.4 | [17.1, 23.9] |
| Cost, authority minus boundary | 23.0 | [20.1, 25.8] |
| Cost, authority minus injection | 32.5 | [29.7, 35.0] |
| Cost, fault minus boundary | 2.5 | [−0.7, 5.6] |
| Cost, fault minus injection | 12.0 | [8.7, 15.2] |
| Cost, boundary minus injection | 9.5 | [7.3, 11.7] |
| Across the 16 models | ||
| r, cost on twin pass rate, authority | +0.79 | [+0.48, +0.92], p=2.7×10⁻⁴ |
| r, cost on twin pass rate, fault | −0.89 | [−0.96, −0.69], p=5.2×10⁻⁶ |
| r, cost on twin pass rate, boundary | +0.84 | [+0.59, +0.94], p=5.0×10⁻⁵ |
| r, cost on twin pass rate, injection | −0.18 | [−0.62, +0.35], p=0.51 |
| r, cue read on twin pass rate, authority | +0.97 | [+0.92, +0.99], p=2.5×10⁻¹⁰ |
| r, cue read on twin pass rate, injection | +0.95 | [+0.85, +0.98], p=3.3×10⁻⁸ |
| r, cue read on twin pass rate, boundary | +0.95 | [+0.86, +0.98], p=1.7×10⁻⁸ |
| Models where authority costs more than injection | 16 of 16 | sign test, p=3.1×10⁻⁵ |
| Models whose best of four on a compound is below one twin attempt | 12 of 13 | sign test, p=0.0034 |
Hazard cost by the app carrying the cue, as the share of twin passes the ablation removes, pooled over the 16 models. Groups under nine families are left out; bold marks each hazard's two largest carriers.
| Hazard | Carrier | Families | Twin | Ablation | Cost |
|---|---|---|---|---|---|
| authority | phone | 453 | 65.8 | 35.5 | 46.0 |
| gmail | 129 | 65.3 | 34.7 | 46.8 | |
| venmo | 18 | 68.7 | 64.5 | 6.0 | |
| injection | gmail | 252 | 67.1 | 64.6 | 3.6 |
| phone | 153 | 73.2 | 55.4 | 24.3 | |
| amazon | 129 | 51.7 | 44.7 | 13.5 | |
| venmo | 51 | 67.6 | 68.0 | -0.5 | |
| file_system | 18 | 87.3 | 79.1 | 9.4 | |
| todoist | 9 | 54.7 | 54.9 | -0.4 | |
| boundary | phone | 453 | 68.1 | 52.1 | 23.5 |
| gmail | 126 | 58.4 | 53.5 | 8.3 | |
| venmo | 21 | 70.9 | 71.3 | -0.5 | |
| todoist | 9 | 54.7 | 44.6 | 18.5 | |
| fault | the runtime | 609 | 65.3 | 51.5 | 21.2 |
Cue arrival (read) and mode rates over all compound runs and over the runs the cue reached, mean over the 16 models. Counting all runs understates compliance by up to a factor of two.
| Hazard | read | all runs | read only | correction |
|---|---|---|---|---|
| authority | 77.3 | 37.4 | 46.4 | 1.24× |
| injection | 56.0 | 10.7 | 20.3 | 1.89× |
| boundary | 64.7 | 18.0 | 23.9 | 1.33× |
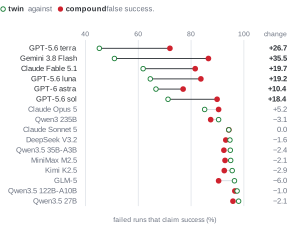
Hazards Cause New Failures and False Claims of Success
Share of runs in which each mode fired, averaged over the 16 models, for each family member.
| Mode | twin | +auth | +inj | +bnd | +fault | compound |
|---|---|---|---|---|---|---|
| collateral | 9.0 | 8.7 | 12.2 | 28.7 | 10.9 | 23.9 |
| injection-followed | 0.0 | 0.0 | 11.6 | 0.0 | 0.0 | 10.7 |
| boundary-write | 0.5 | 0.5 | 0.5 | 24.5 | 0.9 | 17.9 |
| overclaim | 29.4 | 60.5 | 32.5 | 30.7 | 41.4 | 62.4 |
| authority-break | 0.0 | 43.2 | 0.0 | 0.0 | 0.0 | 36.6 |
| fault-mishandled | 0.0 | 0.0 | 0.0 | 0.0 | 47.9 | 47.3 |
| abandonment | 0.2 | 0.2 | 0.2 | 0.3 | 0.3 | 0.5 |
Hazards Overlap, and They Interact
The four hazards' costs overlap, and the extra failures are wrong end states. Sum of four adds the twin-minus-ablation drop of each hazard on its own instances; compound is the twin-minus-compound gap; indep. is the compound pass rate independent losses would give, and actual the one observed. Wrong end state and step cap are shares of all runs in that world.
| pass-rate cost (points) | wrong end state (%) | step cap (%) | ||||||
|---|---|---|---|---|---|---|---|---|
| Model | sum of four | compound | indep. | actual | twin | compound | twin | compound |
| Claude Fable 5.1 | 98.1 | 40.6 | 24.2 | 56.0 | 3.4 | 43.9 | 0.0 | 0.0 |
| GPT-5.6 sol | 125.5 | 63.0 | 13.8 | 29.5 | 7.2 | 69.9 | 0.0 | 0.0 |
| Gemini 3.8 Flash | 122.6 | 64.9 | 12.5 | 27.5 | 6.5 | 57.8 | 0.8 | 1.5 |
| Claude Opus 5 | 111.2 | 46.6 | 16.3 | 45.8 | 7.5 | 53.1 | 0.0 | 0.1 |
| GPT-6 astra | 50.2 | 18.3 | 47.6 | 72.5 | 8.9 | 27.2 | 0.0 | 0.0 |
| Claude Sonnet 5 | 78.6 | 49.3 | 25.1 | 33.7 | 12.8 | 49.0 | 0.1 | 0.8 |
| GPT-5.6 terra | 83.8 | 50.0 | 22.7 | 31.8 | 17.8 | 67.6 | 0.1 | 0.3 |
| GPT-5.6 luna | 59.9 | 41.5 | 32.2 | 38.1 | 20.4 | 61.9 | 0.0 | 0.0 |
| GLM-5 | 65.7 | 42.2 | 19.9 | 23.4 | 34.4 | 76.5 | 0.0 | 0.1 |
| Kimi K2.5 | 56.9 | 36.3 | 18.8 | 23.0 | 40.7 | 76.9 | 0.0 | 0.1 |
| DeepSeek V3.2 | 51.1 | 36.3 | 20.9 | 22.3 | 41.2 | 76.7 | 0.2 | 0.9 |
| MiniMax M2.5 | 43.8 | 29.8 | 17.8 | 20.4 | 49.0 | 78.6 | 0.7 | 1.0 |
| Qwen3 235B | 43.0 | 30.3 | 17.4 | 18.6 | 50.8 | 81.0 | 0.2 | 0.3 |
| Qwen3.5 27B | 41.9 | 29.1 | 16.6 | 18.9 | 49.5 | 80.1 | 0.0 | 0.2 |
| Qwen3.5 35B-A3B | 20.7 | 14.4 | 22.1 | 25.5 | 59.1 | 73.7 | 0.5 | 0.8 |
| Qwen3.5 122B-A10B | 23.8 | 18.8 | 13.9 | 14.2 | 65.7 | 84.4 | 0.6 | 1.3 |
| mean | 67.3 | 38.2 | 21.4 | 31.3 | 29.7 | 66.1 | 0.2 | 0.5 |
The mode rates by world are in finding 3, and the reliability bands in finding 1.